|
Apr 12, 2009
Atlantic dynamo turned up the heat over Medieval Europe
April 3, 2009, PhysOrg.com
In the April 3rd edition of Science a collaborative group of scientists from Switzerland, California and the UK report that medieval climate over Europe was heated by the North Atlantic Oscillation (NAO). This oscillation pattern, defined as the pressure difference between the Icelandic Low and the Azores High, also influences modern-day weather conditions and has contributed to the recent droughts in North Africa and floods in North-Central Europe.

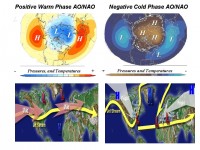
A comparison of tree rings from 1000-year old trees in Morocco and growth layers in a stalagmite from a cave in Scotland now reveal the mechanism behind the “Medieval climate anomaly” - a period of global warmth between 1000 and 1400 AD. During this period, the pressure difference between the Azores High and the Icelandic Low was large and, by driving warm Atlantic winds over the cold European continent in winter time, was heating the European mainland (bottom left in diagram).
Trees and stalagmites are “proxy archives”, meaning that they are natural data sources from which past climatic conditions can be derived. Old cedar trees from the Atlas Mountains in Morocco grew extremely slowly during Medieval Times and thus reflect much drier conditions during this period compared to following centuries. These dry conditions, in turn, are an indicator for a strong Azores High. Opposite to the African tree rings, the Scottish stalagmite shows that during the same period it was much wetter than normal in northern Europe, reflecting a strong Icelandic Low.
Scientists from the Dendro Sciences Unit at the Swiss Federal Research Institute have teamed up with experts from the USA and the UK, including Royal Society-Leverhulme Trust Senior Research Fellow Professor James Scourse of the School of Ocean Sciences at Bangor University, to compile and to develop the first NAO reconstruction to extend back to the Middle Ages. By comparing these proxy archives to modelled climate simulations they were able to analyse temperature, precipitation, and wind conditions across Europe over the last millennium and to test the reliability of their results. Comparisons with other terrestrial and marine proxy archives from across the globe suggest that the changes seen in the NAO are part of a global reorganization of the ocean-atmosphere system.
Valerie Trouet, first author of this study, points out that “the modern-day effects of the NAO are relatively small and short-lived compared to those during the Middle Ages”. This study demonstrates that climate has undergone large changes long before humans started releasing large amounts of greenhouse gases into the atmosphere, indicating that natural forcings should be taken into account when trying to understand the climate of the future. See Climate Audit’s issues with the study and the conclusions of Mann etal that it confirms the Medieval Warm Period as a regional phenomenon focused on Europe. CO2 Science has shown the MWP to be truely global in nature supported by data published by 690 individual scientists from 404 separate research institutions in 40 different countries here.
Apr 12, 2009
“Catlin Team in Peril?
By Harold Ambler
The three-person team of British explorers on the Arctic ice cap may or may not be in danger, depending upon which of the team’s representatives back at headquarters in London is doing the talking. Martin Hartley, Pen Hadow, and Ann Daniels have been on a “scientific” mission to measure sea ice thickness that is routinely measured by satellite and buoys. Unfortunately, just about all of their equipment failed as soon as the team got onto the ice, due to what the BBC has reported as unexpected wind chill values as low as minus 70 degrees Celsius.
On the health front, according to Catlin Arctic Survey medical adviser Doctor Martin Rhodes, the team are battling chronic hypothermia. Additionally, Martin Hartley has frostbite on one foot, photographs of which are on the mission website, with a disclaimer for the faint of heart. On the other hand, according to Catlin communications director Rod Macrae, all is well. “They’re fine,” he said, in a phone interview Thursday. “There is no hypothermia.” Macrae maintained that people with agendas that he didn’t even want to speculate about were looking to criticize the team, when, actually everything is going very well indeed. “Pen [the team leader] has said, “Were stuck in the tent, and we’re unable to take any measurements.” And people have rushed to all sorts of hasty conclusions about their situation being dire or something.”

Pen Hadow and Martin Hartley of the Catlin Arctic Survey battle the elements in the name of science, and their own survival
And yet, according to a blog entry on the Catlin website by support team member Gaby Dean, the team members do not sound normal when they phone in each day, their words slurred and muddled. Macrae was surprised to learn that the team’s “live” biotelemetry (heart rate, breaths per minute, core temperature, and skin temperature) had been repeating for upwards of a week (closer to a month, it turned out). Hadow’s core temperature reading of 33 degrees Celsius (91 degrees Fahrenheit), day after day, had given plenty of the people following the mission pause, if not a sense of foreboding. As for the slurred speech, Macrae explained that when the facial muscles get cold, they do not perform normally.
“All clothing can do is slow down the process of losing heat,” Doctor Rhodes said. “The only way they can keep the hypothermia at bay is to keep moving and to keep eating.” Although the team is equipped with the highest-tech cold-weather gear that money can buy, many have questioned the decision not to use traditional seal and animal fur gear, considered by some experts to be superior in the extreme environment.
As of the end of the day on Thursday, which was a rest day, the team had progressed 245 kilometers. Their goal is to take ice measurements all the way to the north pole, but with only 40 days left before they will be removed from the ice, their pace will have to quicken in order for them to attain their goal. They have 678 kilometers still to travel. The pilots who have brought the team two resupplies are the same ones who will pick them up at the end of the expedition, and they have stated that they are unwilling to risk their aircraft and personal safety on the increasingly questionable ice after May 25, according to Macrae.
“To be honest, reaching the pole is entirely secondary to capturing the scientific data,” Macrae said. When asked whether any sea ice data (live streaming data had been promised prior to the expedition) could be made available, Macrae explained that Catlin had decided to hold off on that for the time being. “We will be putting some data up onto the website, when we think it’s substantial enough to provide something of interest.”
He was pointed in denying that any discussion of removing the team from the ice had taken place. “No, never,” he said. “I think there has been a fairly serious misinterpretation of the situation.” When informed later in the day that the team’s own medical adviser had diagnosed them, albeit remotely, with chronic hypothermia, Macrae responded with an e-mail: “What has been said and is, as you I am sure aware pretty obvious, they are constantly battling hypothermia.” Read more here.
Read also What if the Catlin Arctic Ice Survey is for Naught on Watts Up With That.
Apr 08, 2009
New Climate Change Web Site Promises to be ‘Eco-News on Steroids’
By Matt Cover, CNS News
An environmental news Web site that creators say will be “the most comprehensive information center for climate and energy news and information,” launched Wednesday. “ClimateDepot.com,” which is owned by the Committee for a Constructive Tomorrow (CFACT), is intended to an information clearinghouse featuring investigative reports alongside policy briefs aimed at lawmakers, teachers, parents, and the general public, according to its managing editor, Marc Morano.
“The purpose is to provide the American people and, frankly, the international community with an alternative to the mainstream media and the environmental pablum they serve up to their viewers and readers every single day,” Morano told CNSNews.com
Morano said that the Web site wouldn’t be “just another home” for climate change skeptics - it would expose readers to the entire spectrum of climate change debate. The Web site will feature links to former Vice President Al Gore’s global warming blog, as well as to the U.N.’s Intergovernmental Panel on Climate Change—the world’s premier proponent of “anthropogenic” (man-made) global warming. “What we’re trying to do is offer people a counter (weight),” he said.
The site will also offer research and environmental news that questions the theory of man-made “global warming.” “Parents with kids - who are being fed daily propaganda about the environment and global warming - college kids, teachers, lawmakers, the general public, anyone interested in this issue, they’re going to have an opportunity to read the latest climate and environmental news,” Morano added.
In addition to the latest in environmental news and information, Morano said the site will also serve as an unofficial ombudsman for environmental fact-checking - and will rank reporters based on the accuracy and balance of their environmental stories. Another feature of the site will be informational guides for parents, lawmakers, experts and reporters that concisely explain the complex scientific and environmental issues surrounding the global warming controversy including funding reports that show which advocacy and lobbying groups are bankrolling which public figures.
Morano said he also plans to track what Hollywood celebrities say about environmental issues. Morano, who previously edited the “Senate EPW Press Blog” for Sen. James Inhofe (R-Okla.), the ranking Republican on the Senate Environment and Public Works Committee, is a former investigative journalist who previously worked at CNSNews.com.
The Sierra Club, a liberal environmental group, accused Morano of waging a “disinformation” campaign through his new Web site. “I woudn’t call anything Marc Morano puts out information.” Club spokesman Josh Dorner told CNSNews.com. “I would call it disinformation. Marc Morano and his cohorts are in the business of spreading lies, mistruths, half-truths, and really are the last hold-outs in a debate that has, frankly, moved on from the position that they’re in,” Dorner said.
But the activist is unfazed by the criticism. Environmentalist voices like the Sierra Club’s will be included on the CFACT site, Morano said, in an effort to give the public access to all sides of the climate debate.
“They’re going to see both sides,” he pledged. “They’re going to get to see what Al Gore is saying. They’re going to get to see what the environmentalists are saying. They’re going to get to see what skeptical scientists are saying. They’re going to get to see the latest peer-reviewed studies. It’s a clearinghouse for the latest information.”
The url for the new site is here.
Apr 08, 2009
This Ice Shelf Global Warming Hype Leaves Me cold
Ben Sandilands writes on Crikey
Is misreporting really necessary to get the global warming message across to the masses? Or is the claimed fate of the Wilkins Ice Shelf simply a case of too good a photo opportunity to pass up, or in this case, pass off, as caused by anthropogenic climate change?
The news stories are making it sound like the snapping of the last ice bridge between one part of the crumbling shelf and its main body is a portent of doom for a warming planet. Only a small part of the Wilkins Ice Shelf is affected by this event. It is also located in the Antarctic Peninsula, which is milder and subject to higher snowfall than the main mass of the continent. The mass of ice involved is dwarfed by many larger ice shelf breakouts studied in great detail over the last 60 years in Antarctica.
It is embarrassing to see scientists and newspapers prostitute themselves in this manner. Are they that desperate to seek inclusion in the politically correct but unscientifically sound association of anything and everything with the truly serious matter of climate change?
Ice shelves are dynamic. Just as dynamic as they have been for millions of years, during glacials and interglacials. For eons before our species industrialised and inadvertently set in train the massive liberation of fossilized carbon that has changed the composition and dynamics of the atmosphere, the oceans and the land, the ice shelves were doing precisely what the Wilkins is doing today, accumulating and shedding ice.
The same mechanics drive the growth and decay of ice shelves in a range of polar and sub polar environments, some of them verging on temperate maritime climates like that experienced by the Antarctic Peninsula and others in truly brutally cold regimes like those found closer to the poles. Ice shelves are extrusions of dense ice formed where glacial flows overrun a coastline. When the outflow exceeds the rate at which the glacier can directly fragment into icebergs the glacial mass remains coherent and the surplus pushes outwards into the seas or oceans.
The natural cycle of an ice shelf is to thicken, broaden and fan outwards, until the stresses of thermal erosion by the sea below, the atmosphere above, the subtle but persistent buckling moment of tidal rising and falling, all combine to fracture and break it into thousands of ice bergs, with the largest known to persist for five or more years while drifting for thousands of kilometres.
Somewhere in the southern ocean, the bodies of Robert Falcon Scott and his men rest on such a fragment of the Ross Ice Shelf, awaiting the sea burial which was always their lot after dying there in March 1912 on their return from the South Pole, when their last camp was well away from its outermost edge. There is no doubting the reality of global warming, nor the ways in which it may affect the rate at which ice shelves form and discharge by increasing or decreasing the accumulation of snow that feeds the vast glacial deltas that flow out into the ice shelves. But the Wilkins break up displays the same spectacular process of ice shelf growth and disintegration that has been observed throughout polar exploration.
Plus a new effect, let’s call it the linear oversimplification of the global warming message regardless of the actual science. The sharp fault lines in the Wilkins break up are break points, not melt points. They would have fractured that way regardless of whether the Wilkins environment has warmed (or even cooled) by the few degrees that have been claimed for it. There is nothing new either about massive outbreaks of icebergs from ice shelf collapses. In November and early December 2006, for only the second time in 75 years, icebergs were visible on the ocean horizon from high hills near Dunedin, New Zealand. The early voyages to Australia reported icebergs in similar latitudes to Tasmania and as far north as close to the Cape of Good Hope, while in 1868, one ship reported a sighting off Cape Leeuwin in Western Australia. In 1894 an iceberg was sighted in the western southern Atlantic in Brazilian latitudes.
The real science of climate change is very complex but also convincing. Could it be that the seriousness of these issues is being undermined by an unscientific determination in some quarters to convert almost anything that happens in the natural world into an unnatural opportunity to preach a doctrine rather than a science to the general population? Tragically for the planet, the Wilkins media event serves to deflect attention from the Rudd Government’s determination to do nothing to diminish the mining of coal which results in the liberation of copious quantities of fossilized carbon which constitutes the overwhelmingly largest cause of the greenhouse gas effect in the lower atmosphere. The circus of photo opportunity, glib sanctimonious platitudes and compliant media reporting rolls on.
Apr 06, 2009
Mt. Redoubt Eruptions – What Effect If Any on the Summer? Winter?
By Joseph D’Aleo in Intellicast
Starting on March 22, a series of major eruptions have taken place from Mt. Redoubt in Alaska. The biggest exceeded 65,000 feet in height. More than a dozen eruptions as high as 60,000 have followed the first week alone. Activity may continue for weeks or months based on the volcano’s history. Climatologists may disagree on how much the recent global warming is natural or manmade but there is general agreement that volcanism constitutes a wildcard in climate, producing significant global scale cooling for at least a few years following a major eruption. However, there are some interesting seasonal and regional variations of the effects.
Oman et al (2005) and others have shown that though major volcanic eruptions seem to have their greatest cooling effect in the summer months, the location of the volcano determines whether the winters are colder or warmer over large parts of North America and Eurasia. According to their modeling, tropical region volcanoes like El Chichon and Pinatubo actually produce a warming in winter due to a tendency for a more positive North Atlantic Oscillation (NAO) and Arctic Oscillation (AO). In the positive phase of these large scale pressure oscillations, low pressure and cold air is trapped in high latitudes and the resulting more westerly jet stream winds drives milder maritime air into the continents. Oman found high latitude volcanoes like Katmai (Alaska in 1912) instead favored the negative phase of the Arctic and North Atlantic Oscillations and cold winters. In the negative phase, the jet stream winds buckled and forced cold air south from Canada into the eastern United States and west from Siberia into Europe. They also favored a cooling of middle and higher latitudes the year round of that atmosphere and a weakening of the summer monsoon in India and Africa.
In this analysis, we looked at 11 significant high latitude volcanic eruptions in Alaska, Iceland and Russia (Kamchatka) and any observed climatic effects. Here are two examples:
KATMAI/NOVARUPTA
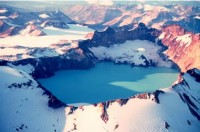
The largest eruption in the world last century (VEI=6) occurred in 1912 at Novarupta on the Alaska Peninsula. An estimated 15 to 30 cubic kilometers of magma was explosively erupted during 60 hours beginning on June 6—about 30 to 60 times the volume erupted by Mount St. Helens in 1980! The expulsion of such a large volume of magma excavated a funnel-shaped vent 2 kilometers wide and triggered the collapse of Mount Katmai volcano. Katmai was once a cluster of 3 or 4 small volcanoes. Pyroclastic flows traveled as far as 15 miles (23 km) and filled a valley adjacent to the volcano to produce the Valley of Ten Thousand Smokes. The withdrawal of magma from beneath the cluster of small volcanoes at Katmai caused the area to collapse and produce a caldera. A lake has filled part of the caldera. The summer in the lower 48 states was a cool one nearly coast to coast.

ICELAND VOLCANOS
LAKI
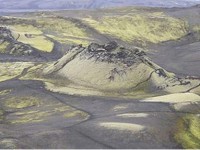
Laki, volcano, 2,684 ft (818 m) high, S Iceland, at SW edge of the Vatnajokull glacier. Its eruption in 1783 was one of the more devastating on record, leading to the deaths of a quarter of Iceland’s inhabitants (mainly due to a famine that resulted from the eruption’s effects). Haze from the eruption spread over parts of Europe, where some experts believe it affected the inhabitants’ health.

Laki is also known for its atmospheric effects. The convective eruption column of Laki carried gases to altitudes of 15 km (10 miles). These gases formed aerosols that caused cooling in the Northern Hemisphere, possibly by as much as 1 degree C. This cooling is the largest such volcanic-induced event in historic time. In Iceland, the haze lead to the loss of most of the islands livestock (by eating fluorine contaminated grass), crop failure (by acid rain) and the death of 9,000 people, one-quarter of the human residents (by famine).
This event is rated as VEI6 on the Volcanic Explosivity Index, but the eight month emission of sulfuric aerosols resulted in one of the most important climatic and socially repercussive events of the last millennium.
In Great Britain, the summer of 1783 was known as the “sand-summer” due to ash fallout. The eruption continued until 7 February 1784. Grímsvotn volcano, from which the Laki fissure extends, was also erupting at the time from 1783 until 1785. The outpouring of gases, including an estimated 8 million tons of fluorineand estimated 120 million tons of sulfur dioxide gave rise to what has since become known as the “Laki haze” across Europe. This was the equivalent of three times the total annual European industrial output in 2006, and also equivalent to a Mount Pinatubo-1991 eruption every three days. This outpouring of sulfur dioxide during unusual weather conditions caused a thick haze to spread across western Europe, resulting in many thousands of deaths throughout 1783 and the winter of 1784.This disruption then led to a most severe winter in 1784, where an estimated to have caused 8,000 additional deaths in the UK. In the spring thaw, Germany and Central Europe then reported severe flood damage.
In North America, the winter of 1784 was the longest and one of the coldest on record. It was the longest period of below-zero temperatures in New England, the largest accumulation of snow in New Jersey, and the longest freezing over of Chesapeake Bay. There was ice skating in Charleston Harbor, a huge snowstorm hit the south, the Mississippi River froze at New Orleans, and there was ice in the Gulf of Mexico.
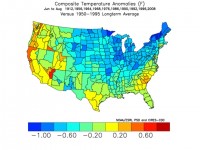
I averaged the 10 volcano years this last century for summer and winter temperatures. This is the summer composite finding:

See all 11 volcanos and winter average here.
|
|
|
|


